Has Silver Finally joined the Gold Party?

The Spotlight

1 minute read

May 31, 2020

shiny gold coins compared to silver

A look at how the gold to silver ratio has been moving in the past few months.

120 ounces and counting!

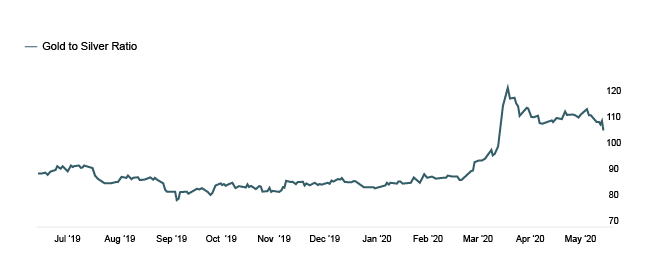
On March 18, the gold to silver ratio reached the all-time high of 124:1.

On that day, we needed 124 ounces of silver to purchase 1 ounce of gold.

As we can see in the chart below, in 2019, the ratio fluctuated between 80:1 and 90:1 before shooting up in March 2020.

chart showing a sharp increase in the gold to silver ratio

If we looked further back in time, we would see that before 2000 the average ratio was 47:1. And from 2000 to 2018, it fluctuated between 50:1 and 70:1.

So from a historical standpoint, the current ratio looks like an isolated event.

Even more so knowing that, in the Earth's crust, the gold to silver ratio is estimated at 18:1.

And what does that tell us? One of two things:

That gold is overvalued compared to silver and therefore more likely to trade down.

OR

That silver is undervalued compared to gold and therefore more likely to trade up.

Whatever the answer, this is a chart every precious metals buyer needs to watch closely.

Photo credit: Travel Photographer

image-letter

The Spotlight

The free newsletter helping you understand how to build your wealth.


image-letter

Get the Spotlight

The free newsletter helping you understand how to build your wealth.