Saving and investing during inflation 💸 can be a real headache for many of us. One solution that often comes to mind is investing in physical assets such as gold and silver.
However, it's not always easy to know when to invest in one metal over the other, or when to sell. Luckily, there's an (almost) magical tool that can help you with decision-making: the gold-to-silver ratio. 📈
What is the gold-to-silver ratio and how does it work?
No need to panic if math isn't your strong suit🤓, as the concept of the gold-to-silver ratio is relatively easy to understand. It simply shows the ratio between the price of gold and the price of silver.
Basically, the ratio tells you the number of ounces of silver required to buy one ounce of gold. For example, if the gold-to-silver ratio is 45:1, that means one ounce of gold is worth 45 ounces of silver.
But why bother with the gold-to-silver ratio when you could just look at the prices of gold and silver separately, you may ask?
Merely looking at the prices of gold and silver provides only partial information. However, the gold-to-silver ratio offers a way to assess the relative popularity of one metal compared to the other. This makes it a valuable tool for investors:
- When the ratio is high, it means that the price of silver is undervalued compared to the price of gold. In other words, it may be a good time to buy silver and sell gold.
- When the ratio is low, the opposite is true. Investors may want to consider buying gold and selling silver instead.
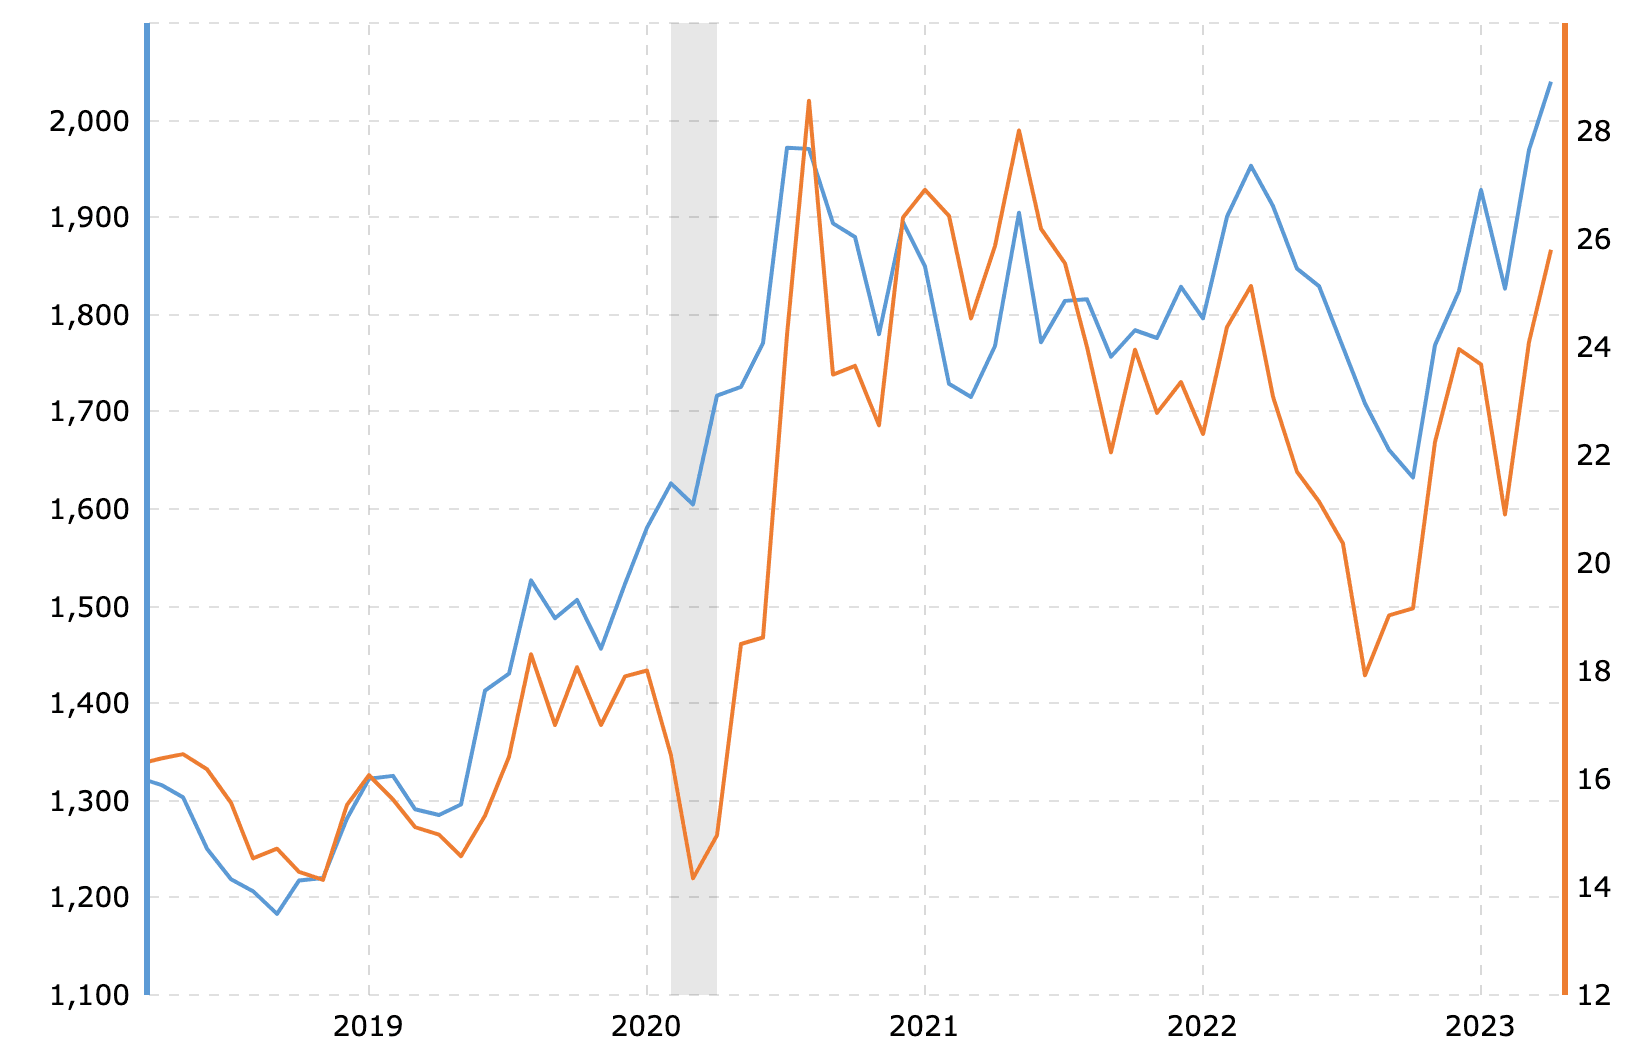
Take a look at the graph below showing the price of gold (in blue) and the price of silver (in red) over the past 5 years:
While the prices of gold and silver generally follow a similar trend, it is evident that silver experiences greater fluctuations, particularly since 2020. This is mostly because silver is a more volatile asset, meaning it can experience more dramatic price swings compared to gold.
💡3 tips for effectively using the gold-to-silver ratio
- The gold-to-silver ratio typically ranges between 40:1 and 80:1. It's when the values fluctuate towards these extremes that investors usually make the decision to buy or sell.
- Keep in mind that the gold-to-silver ratio is just one tool for analysis among many. Investment decisions should not be solely based on this ratio.
- Regularly monitor the ratio to identify potential opportunities for buying or selling gold and silver, but also consider other factors such as market trends, economic conditions, and geopolitical events that can impact the value of precious metals.
What factors influence the gold-to-silver ratio?
There are several factors that can have an impact on the gold-to-silver ratio. Let’s look at each of them in detail.
Supply and demand
Could changes in demand for one metal versus the other affect the gold-to-silver ratio itself?💡
Well, yes, most likely. If all investors decide to buy silver because it is undervalued, then:
- the demand for silver becomes greater,
- this increased demand will drive up the price of silver,
- the gold-to-silver ratio will therefore be lower (it will take fewer ounces of silver to buy one ounce of gold).
But that's the theory. In practice, the gold-to-silver ratio is also influenced by other factors.
💡What if a large amount of gold is discovered in mines?
Although highly unlikely, let's imagine it for a moment. A lucky mining company discovers several tons of gold. What would happen?
Well, it would change the structure of the supply of gold. By injecting this additional supply into the market, the price of the famous yellow metal would be impacted, likely decreasing. The gold-to-silver ratio would thus drop, indicating an overvaluation of silver compared to gold.
Global economy and geopolitics
Precious metals are considered safe-haven assets: when the global economy is in turmoil, investors tend to flock to a reliable store of value to protect their wealth.
If the global demand for gold, the ultimate safe-haven asset, increases while silver is neglected, the gold/silver will go up. This is what happened during the Covid pandemic.
Electronics, a silver-hungry market
The electronics industry has undergone a spectacular transformation over the past century. The demand for silver, which is widely used in electronic components, has continued to grow.
In 2020, this sector represented approximately 9% of the global demand for silver, according to the Silver Institute. The consequence? A decline in the gold/silver ratio.
How to use the gold-to-silver ratio in your investment strategy?
The gold-to-silver ratio can serve as a hedging tool. This means it is possible to take an optimistic view with one of the metals, while keeping a short position in the other metal.
One strategy based on the gold-to-silver ratio is to sell the “overpriced” metal and buy the undervalued one. After a year or two, when the ratio shifts in the opposite direction, you can sell the “undervalued” metal and buy back the overpriced one.
Here’s an example:
🤔 Let's say the current gold-to-silver ratio is 60, meaning it takes 60 ounces of silver to buy one ounce of gold. You believe that silver is currently undervalued relative to gold, and you decide to sell one ounce of gold for 60 ounces of silver.
A few years later, the ratio drops to 30, meaning it now takes 30 ounces of silver to buy one ounce of gold. At this point, you decide to sell your 60 ounces of silver and buy two ounces of gold with the proceeds.
As a result, you have doubled your investment, going from one ounce of gold to two in just two trades based on the gold-to-silver ratio.
The gold-to-silver ratio throughout history
Historical records of the gold/silver ratio show that it has varied widely over time.
The 1991 high
Excluding the COVID-19 pandemic, the highest gold/silver ratio ever recorded was in 1991 when it reached 100:1. At that time, it took 100 ounces of silver to buy one ounce of gold.
Why was silver so undervalued? There were several reasons:
- A global decrease in demand that impacted the electronics industry.
- An oversupply of silver compared to the low demand, due to the (over)productivity of mines and the selling of the precious metal by many central banks.
At that time, silver was very cheap, costing only $4.40 per ounce!
The 2011 low
On the other hand, the gold/silver ratio dropped to 32:1 in 2011, its lowest level since 1983. Among the reasons cited was an increased demand for silver from the industrial sector, which drove up its price.
The gold-to-silver ratio since the Covid-19 pandemic
The future history textbooks dedicated to the 2020s are likely to feature numerous significant events, such as the Covid-19 pandemic, inflation, and the Ukrainian conflict. These events have had an impact on a lot of things, including the gold-to-silver ratio.
In 2020, at the height of the pandemic, it reached 120:1 due to a real rush for gold.
Since then, the gold/silver ratio has been declining. Not because demand for gold is decreasing, but because industrial demand for silver is once again on the rise.
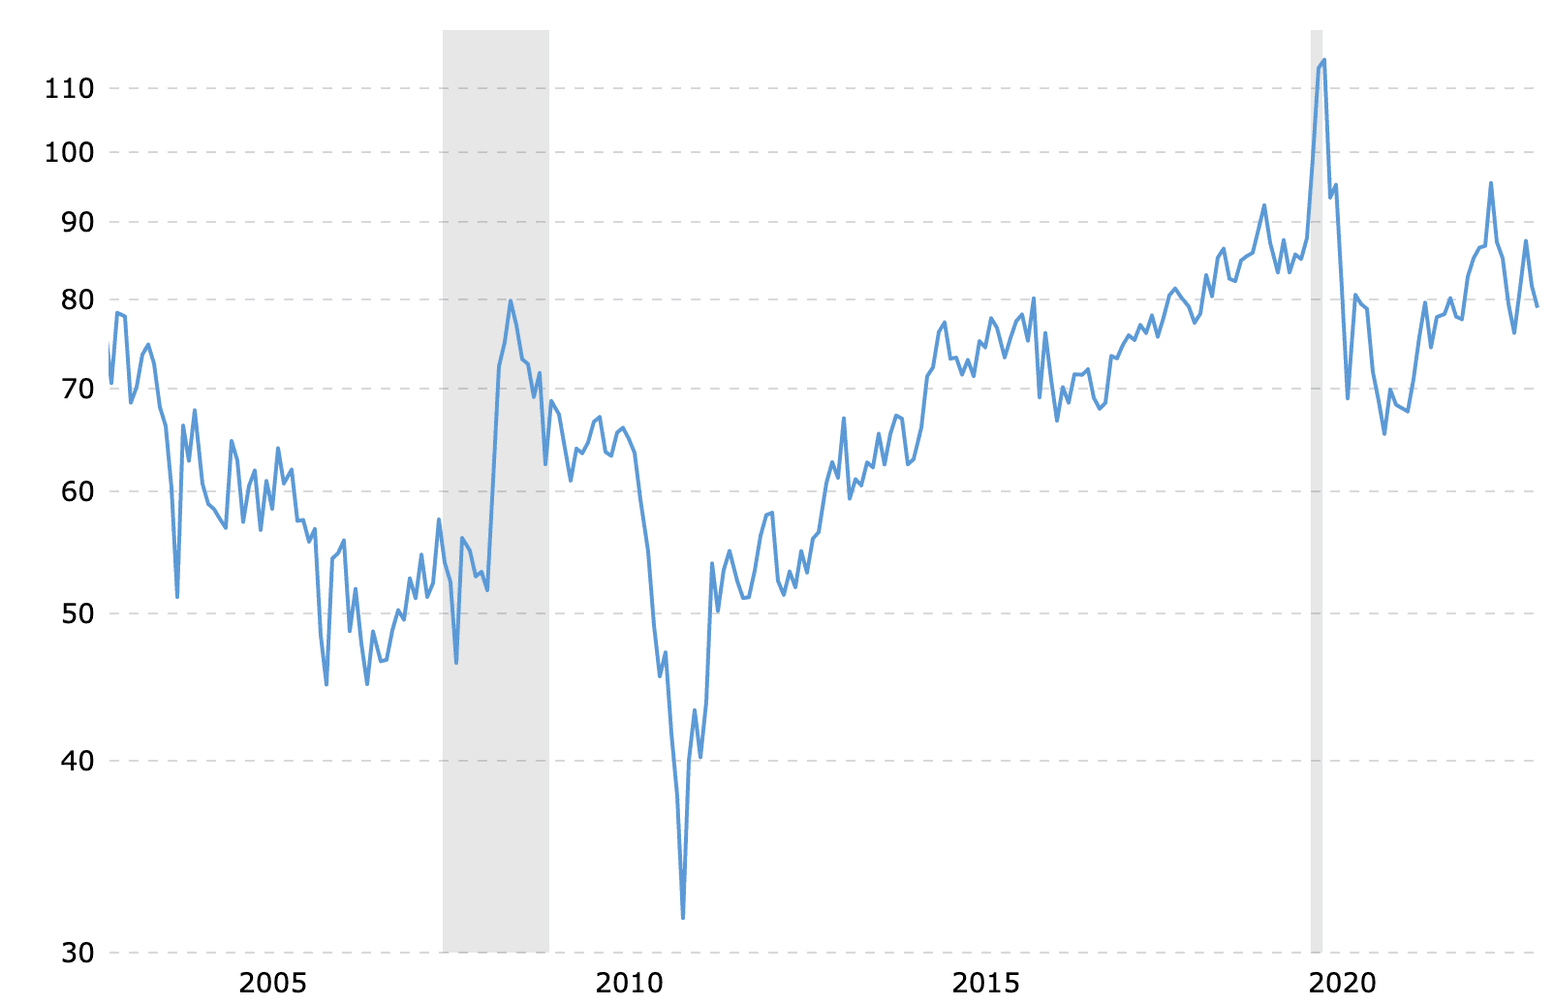
Here’s how the gold-to-silver ratio changed over the past 30 years:
Two periods are particularly noteworthy for the gold-silver ratio: the "post-crisis" of 2011 and its renewed interest in silver, and the rush to gold at the start of the COVID-19 pandemic in 2020.
What are the key takeaways?
- The gold-to-silver ratio is a useful tool that lets you see which of these precious metals is more in demand at any given time. And if you're thinking of buying gold bullion or investing in silver, like coins or bars, this ratio can give you a good idea of how much of each to get and when to sell.
- But don't forget, it's not the be-all and end-all! You still need to do a bit more digging and really think about what you want to achieve with your investment and how you're going to get there. The ratio is just one piece of the puzzle.