What Can We Learn From the Dow to Gold Ratio?

The Spotlight

3 minutes read

Feb 28, 2023

Gold investment business financial stock market candlestick on black background

Savers and investors use this one tool to find the best time to buy and sell gold and stocks. Here's why it's so great.


When you're building your gold savings or investment portfolio, you might think you need a magic crystal ball 🔮 to predict the gold price, and pick the right time to buy or sell your bars and coins.

Well, it's almost true. There’s no strategy that will give you a definite answer, but there’s a tool that could help you make a well-informed decision. It’s called the Dow to gold ratio.

Over the years, this ratio has helped many savers and investors avoid some of the biggest stock market crashes, steering them toward safe-haven assets like gold at the right time.

Let’s see how the Dow to gold ratio works and how it can help you understand when to buy gold.

What is the Dow to gold ratio?

Financial graphs and digital indicators overlap with modernistic urban area

The Dow Jones Industrial Average, Dow Jones, or simply the Dow, is a stock market index that tracks the stock price of 30 of the largest companies in the U.S.

Amongst them: Apple, Goldman Sachs, Johnson & Johnson, McDonald's, IBM, Coca-Cola, etc...

The Dow to Gold ratio shows how many ounces of gold it takes to buy the shares in the Dow Jones Industrial Average index. For example, if the ratio is 10, that means we need 10 ounces of gold to buy the Dow.

Now, this ratio is actually pretty useful because it can tell us whether stocks or gold are more expensive or cheap. Here's how it works:

When the ratio is high, that means stocks are expensive and gold is undervalued. In other words, you'll need a lot of gold to buy the Dow, which means stocks are probably overpriced compared to gold. Conversely, when the ratio is low, that means stocks are undervalued and gold is expensive.

So what does this all mean? Well, basically, if the ratio is increasing, that's a sign that you might want to sell some of your stocks and buy some gold instead, and vice versa.

💡Quick tip

It's important to keep in mind that the Dow to gold ratio is just one tool you can use to make investment decisions. It's not a guarantee of anything, but it can be a helpful indicator of how expensive or cheap stocks and gold are relative to each other.

As with any investment decision, it's always a good idea to do your own research, consider your own personal financial goals and risk tolerance, or seek the advice of a financial professional if you're unsure about what to do.

How do you use the Dow to gold ratio?

Investors have been using the gold-to-Dow ratio for over 100 years to guide their investment decisions rather than follow it as a strict rule.

One notable investor who uses this ratio is Bill Bonner, who focuses on the reference points of 5 and 15. Bonner sells stocks and buys gold when the ratio goes above 15, indicating that gold is undervalued compared to the Dow.

Otherwise, Bonner sells gold and buys stocks when the ratio falls below 5, suggesting that stocks are undervalued relative to gold.

🤓 Here’s a cheat sheet:

  • If the ratio goes above 15: it takes 15 ounces of gold to buy the Dow. Gold is considered undervalued (cheap) compared to the Dow Jones Index.
  • If the ratio falls below 5: this means that it takes just 5 ounces of gold to buy the Dow. Stocks are undervalued relative to gold.

To give you some more pointers, let’s also take a look at how the Dow to gold ratio has worked through history.

Where is the Dow to gold ratio today?

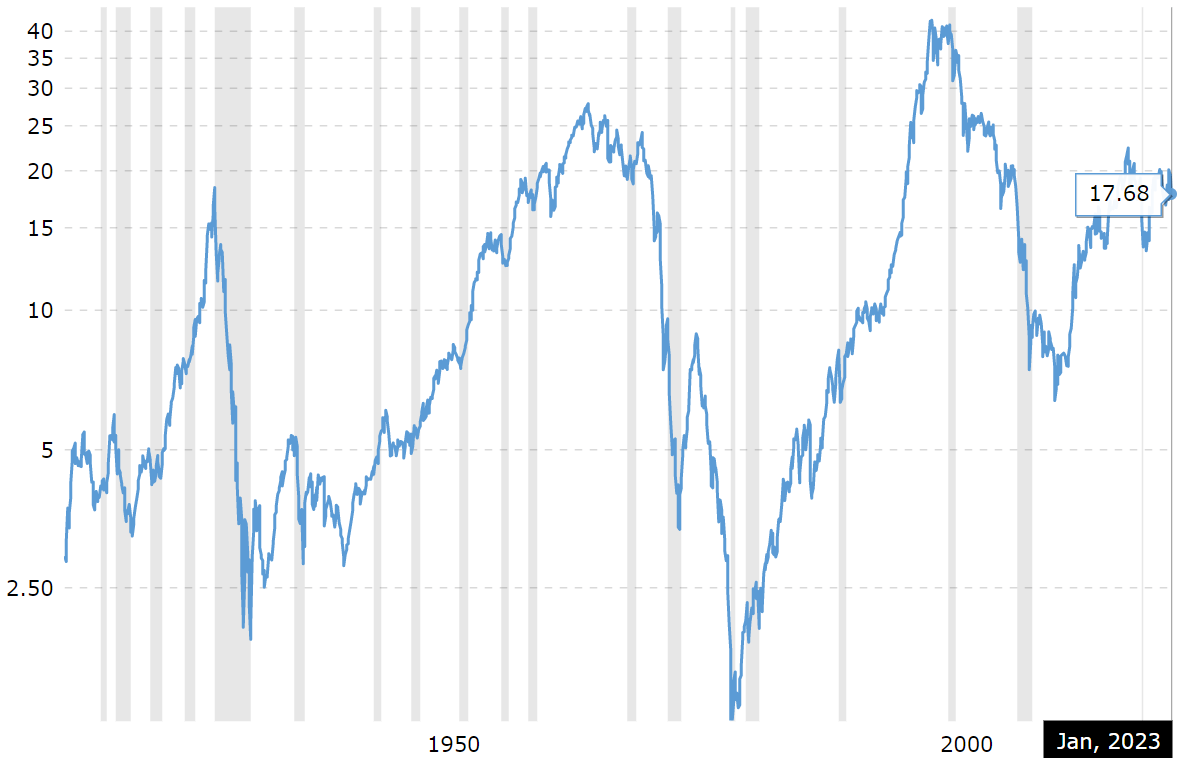
Throughout history, the gold-to-Dow ratio has experienced significant fluctuations, ranging from a low of 1.0 during the stock market crash of 1980 to above 40 during the dot-com bubble of 2000.

Wallstreet bull and bear on stock chart background representing a positive outlook for gold

Right now, it’s going up, which means that those who use the ratio might interpret these fluctuations as a reason to be bullish about gold.

Here’s the chart:

A historic Dow to Gold ratio chart running from 1930 to 2023.
Dow to gold ratio on January 2023.

As you can see, in June 2022, the Dow to gold ratio experienced a significant decline. Analysts have noted that following financial crises, the ratio tends to decrease rapidly. For instance, in 2010, the ratio dropped to approximately 7, and in 1980, it fell to as low as 1.

However, in January 2023, the ratio went above 15, reaching 17.68. This puts gold in undervalued territory, according to Bill Bonner’s take on the Dow to gold ratio.

So, are you planning to follow the ratio and ditch some of your stocks to get yourself some physical gold? 🙂

image-letter

The Spotlight

The free newsletter helping you understand how to build your wealth.


image-letter

Get the Spotlight

The free newsletter helping you understand how to build your wealth.