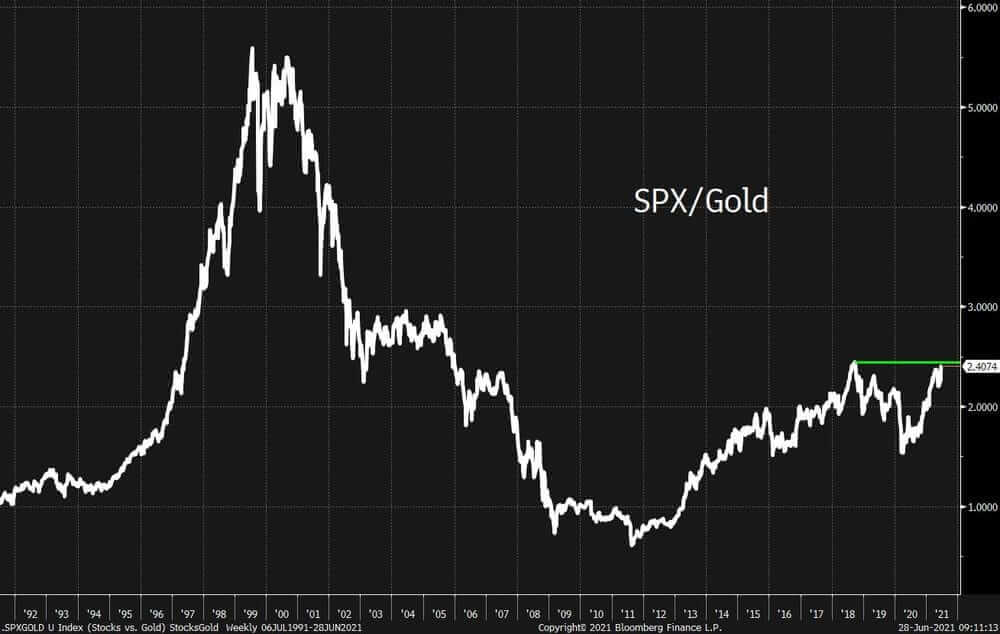
The S&P 500-to-gold ratio is a useful tool used by gold investors to know when to sell or buy physical gold.
At the moment, it seems that the ratio is getting bullish for the yellow metal.
Let’s see why.
First, how does the S&P 500-to-gold ratio works?
To put it simply, the lower the ratio, the more expensive gold will be relative to the S&P 500 Index, and the higher the ratio, the more inexpensive gold will be relative to the S&P 500 Index.
In other words, a low ratio tends to indicate that gold is overvalued compared to stocks, while a high ratio will indicate that gold is rather undervalued compared to stocks.
The S&P 500-to-gold ratio is, in a way, a very useful thermometer to gauge investor’s sentiment about stocks and gold.
And what does it tell us today?
As we can see from the chart below, the ratio has been approaching its 2018 peak. And if it surpasses that level, it will be at a more than 15-year high.
What does it mean exactly?
Well, it means that investors' sentiment that gold is undervalued (or that stocks are overvalued) is growing.
For example, in September 2011, about 20.73 g of physical gold was enough to buy one S&P 500 “share.” In early July, however, it had gone up to roughly 77.76 g for one share.
Isn’t it an interesting way to find out that gold might be undervalued right now? 🤓
In our next issue, we’ll finish this unofficial series on gold’s bullish momentum by taking a look at one of the most widely-used investment strategy: the DCA strategy.